Hi, I am Surbhi Bhor

Data Enthusiast

Data & BI Engineer with a Master’s in Information Management from the University of Illinois and a background in Electronics Engineering. Passionate about transforming raw data into actionable insights, I have delivered impactful solutions at Whole Foods Market/Amazon, Boston Consulting Group (BCG), and Capgemini—building scalable ETL pipelines, optimizing data workflows, and creating interactive dashboards that drive measurable business outcomes.

Actively seeking full-time opportunities in Data Engineering & Analytics.


Contact Me

About Me

My Introduction

As a Business Intelligence Engineer at Whole Foods Market/Amazon, I design and enhance QuickSight dashboards, develop automated ETL pipelines using Spark SQL, Redshift, and AWS services, enabling leadership to track KPIs and improving processing efficiency by 35%. During my tenure as a Data Engineer Intern at Boston Consulting Group (BCG), I built Azure Synapse pipelines, engineered batch ingestion processes, and implemented data quality validation using PySpark, reducing discrepancies by 75%. At Capgemini, I focused on automating APIs using AWS Lambda, Step Functions, and API Gateway with JavaScript and Node.js, streamlining workflows and improving integration quality. With a strong foundation in programming, cloud platforms, and BI tools, I bring a problem-solving mindset and data-driven approach to every project. Beyond work, I’ve led as Marketing Head of the IEEE student chapter and served as Dance Head for my university crew, achieving multiple national and intercollege wins.

Qualification

My personal journey
Education
Work

Master's in Information Management

University of Illinois, Urbana Champaign
August 2022 - May 2024

Bachelor's in Electronics Engineering

University of Mumbai, India
August 2016 - October 2020

Business Intelligence Engineer

Whole Foods Market, Austin
Dec 2024 - Present

Data Engineer Intern

The Boston Consulting Group, New York
June 2023 - August 2023

Automation Engineer

Capgemini, India
September 2020 - June 2022

Experience

BI
Engineer

View more

Business Intelligence Engineer – Whole Foods Market / Amazon

Tech Stack: AWS (Andes, S3, Lambda, Redshift, QuickSight), Spark SQL (Cradle)

  • Designed and enhanced QuickSight dashboards across Supplier Marketing, Parcel Returns, and Seasonal Reporting programs, enabling leadership to track KPIs such as sales lift, new-to-brand lift, YoY growth, return types, and same-day conversions.

  • Developed automated ETL pipelines using Spark SQL (Cradle) and Redshift to extract from Andes/S3, transform large datasets, and load into reporting data marts — reducing data processing time by 35% and minimizing manual errors.

  • Optimized Spark SQL queries by 25% through partitioning, broadcast joins, and resource tuning, improving pipeline stability and efficiency.

  • Automated ingestion of manual source trackers with AWS Lambda and S3, ensuring timely seasonal reporting and eliminating delays caused by manual processes.

  • Partnered with business stakeholders to define metrics and create data flow diagrams; validated Redshift SQL queries and dashboard logic, ensuring accuracy, scalability, and delivering visibility into ~$5.9M in supplier program entitlements.

Data Engineer Intern

View more

Data Engineer Intern - BCG

Tech Stack: Azure Synapse, Azure Data Lake Storage (ADLS), PySpark, ERD Tools

  • Built Azure Synapse data pipelines to initiate ETL process for efficient initial and incremental data loads across data layers

  • Transformed and curated over 25000 records into a staging Hive table using ADLS and data warehouse resulting in a SCD1 delta table, reducing data discrepancies by 75%

  • Implemented data quality validation with PySpark notebook, resulting in the identification and resolution of a critical bug, enhancing data integrity

  • Strategically assessed six ERD migration tools, seamlessly transitioning to the optimal solution, resulting in enhanced real-time collaboration and significant time-saving advantages

  • Orchestrated comprehensive data modelling for a complex domain spanning 15 diverse tables, translating it into an effective ER diagram and further enhancing understanding through strategic creation of data flow diagrams for multiple pods

Automation Engineer

View more

Automation Engineer, Capgemini

Tech Stack: AWS (Lambda, Step Functions, API Gateway, CloudWatch, DynamoDB), JavaScript, Node.js, Azure DevOps, Jenkins

  • Led the development and implementation of automated testing procedures through Jenkins, ensuring the seamless deployment of software releases for the backend of the application.

  • Directed and maintained a robust suite of automation test scripts utilizing an internal AWS framework comprising lambda, step function, and API gateway. Leveraged lambda functions and state machines to intricately chain together function calls, optimizing test case outcomes.

  • Integrated smoke, regression, and integration test suites into the Azure DevOps CI/CD pipeline using API gateway, enhancing the efficiency of the continuous integration and deployment processes.

  • Elevated test case coverage by 70% through the automation of critical AWS functionalities, including Cloudwatch logs and DynamoDB.

  • Developed and scripted over 200 API test cases for smoke, regression, and integration scenarios, contributing to the overall robustness of the testing framework.

  • Collaborated closely with the manual test team to analyze detailed test requirements, subsequently creating comprehensive test data sheets for automation.

  • Pioneered the creation of reusable actions within automated test scripts, facilitating streamlined adaptation to automation code changes across various microservices in response to evolving functionalities.

Projects

Most recent work

Azure ETL pipeline for Stadiums Data: Airflow, Tableau, Python

Designed an ETL pipeline using Apache Airflow to extract stadium data from Wikipedia, efficiently storing the records in Azure Data Lake Gen2. Architected data storage and migration solutions with Azure Data Factory and Azure Synapse Analytics, and visualized the results in Tableau to provide comprehensive insights into stadium capacities and locations.

Link
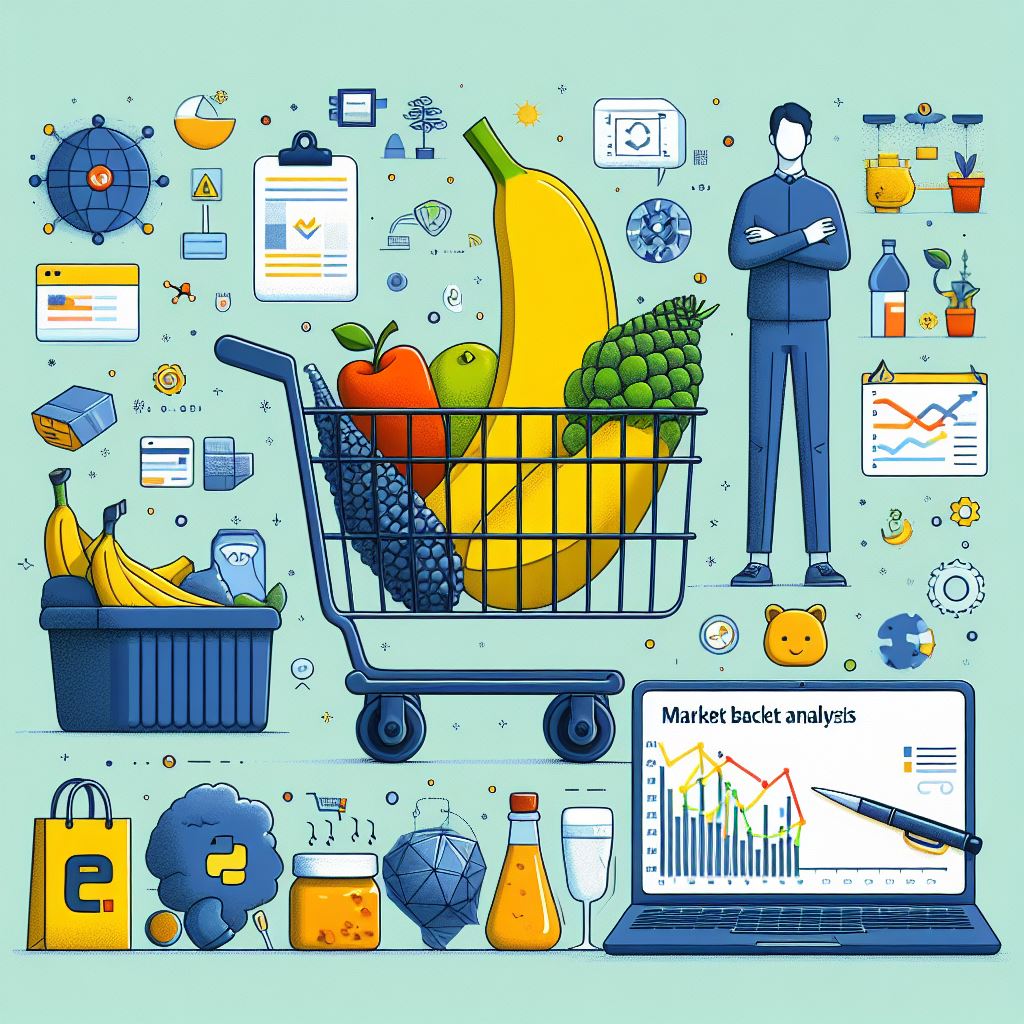
Instacart Market Basket Analysis: Tableau, Python

Applied dimensional modeling techniques, including star schema-based data models, ER diagram and designed a Tableau dashboard to analyze customer behavior and product performance, providing valuable insights. Conducted exploratory data analysis using Python libraries such as NumPy and Pandas, leveraging seaborn and matplotlib for visualizations

Link

Crimes against women: SQL, PowerBI

Populated crimes against women database with over 10,000 rows and 11 columns ensuring ACID properties to maintain integrity and consistency of data using SQL, which reduced data discrepancy by 11%. Created an interactive dashboard in PowerBI to examine historical crime trends and demonstrated how crimes against women increased exponentially from 2001 to 2014, in which approximately 5M crimes were reported.

Link

Flight Booking System: MEAN Stack

Developed a dynamic full-stack application with Node.js, Express.js, and Angular, featuring micro-services, JWT authentication, Razorpay for payments, nodemailer for emails, and Swagger Hub for API documentation. Ensured reliability through Mocha & Chai testing and deployed on AWS using lambda functions and S3. Efficiently migrated the database from MongoDB to DynamoDB using DMS-Database Migration Service.

Link

Mapping Storm event: NOAA Dataset Visualization

Implemented real-time dataset updates through Beautiful Soup web scraping for generating visualizations that address pivotal research questions and provide data-driven insights into storm events across the United States. Additionally, crafted interactive visualizations using Altair, Matplotlib, and Vega-Lite. This involved developing high-quality charts and graphs, as well as dynamically manipulating data to enhance the overall effectiveness and interactivity of the visual representation.

Link
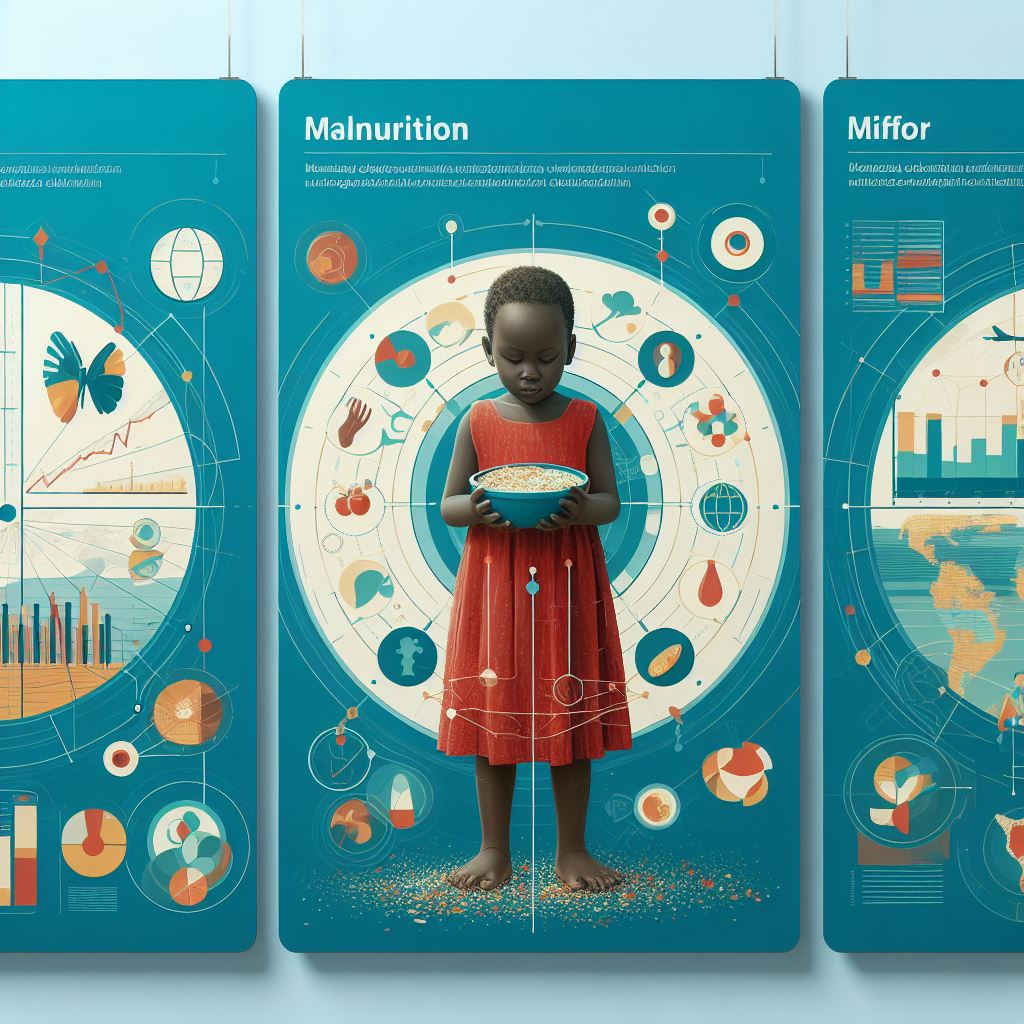
UNICEF Malnutrition Dataset analysis & Visualization

Leveraged malnutrition data sourced from UNICEF, inclusive of data spanning all countries and UN regions. Exploratory Data Analysis (EDA) and precise data cleaning techniques using Pandas were employed to prepare the dataset for more effective visualization. Developed insightful visualizations by harnessing the capabilities of the Plotly library that addressed critical inquiries surrounding malnutrition factors, including stunting, wasting, underweight, and overweight.

Link

Leadership, Impact, and Milestones

Making a difference
Extracurricular Leadership and Achievements
  • Led college dance crew to numerous victories, securing 18 out of 24 competition wins and achieving 3-time runner-up status at the national level competitions.

  • Demonstrated exceptional leadership as the Marketing Head for IEEE in 2018-19, and actively contributed as a member, organizer, and event head from 2016 to 2019.

  • Elevated online presence by increasing followers by 36% as a Social Media Coordinator and Content Writer for both Footloose Dance Crew and IEEE.

Social Work and Volunteer Experience
  • Contributed to social welfare as a dedicated volunteer at 'Adoptathon 2019' organized by World for All Animal Care and Adoptions.

  • Actively participated in the social wing of the student chapter, engaging in various initiatives that made a positive impact on the local community.

Professional Achievements
  • Received the "Pat on the Back" award during monthly Recognition and Rewards (RnR) for consistent delivery of high-quality work and dedication to excellence.

  • Awarded for innovation and proactive initiatives within the team, contributing significantly to the automation process under the Kaizen framework

  • Successfully spearheaded the quality assurance (QA) efforts for two domains independently, showcasing meticulous attention to detail, analytical skills, and a commitment to ensuring top-notch standards in all projects undertaken.

Contact Me

Get in touch

Location

Austin - TX, USA